The Summer Political Break has come and I want to reflect on something that rarely gets airtime, What do young people think about Brexit and Government in general?
I’m not talking about 18+ so much, but those who would not have the chance to vote, growing up with such a huge change in the making and being unable to have their say.
I think to find that out for myself, I needed to a bit more digging than taking research through online methods, and allow myself to be more proactive in self- research and journalism.
I don’t pretend that this is a flawless article, nor do I accept that it has an answer to the current situation.
UK ‘Brexit’ Research Project
Researcher & Publisher: Sophia
Title: To what extent is our withdrawal from the EU shaping the minds of young people?

Contents Page:
Abstract
LO1 – Introduction: Page 2
– Aims and Objectives: Page 3
LO2/LO3 – Rationale – Research Methods: Page 5
LO4/LO3 – Analysing and Displaying Data: Page 8
LO5/LO3/LO6 – Analysis, Synthesise and Use Information & Present Outcome: Page 25
– Appendix: Page 34
– Bibliography: Page 36
LO8 – Self Evaluation: Page 41
LO7 – Conclusion: Page 42
Abstract
Within the project, I will identify what young people’s opinions are regarding Brexit.
It will become apparent that most young people support the UK remaining in the EU.
There is support in having a second referendum if needed, but this does not fit the view among older people.
Additionally, in this project the factors that have an influence on people views will be identified. Overall, I have discovered that withdrawing from the EU has a contributing factor at shaping young people’s minds and impacting
their future aspirations. I will undertake various research within the project, and also look at a variety of perspectives in order to prove this conclusion.
If you’re after the main chunk of data and explanation, it begins at RESEARCH & RATIONALLE.

Introduction
What are you studying?
I am studying the impact that political events have on the opinions and views of different social groups, especially the young generation.
I want to find out what young people think on issues like Brexit, political parties and how their future will be decided by what goes on in the political world. I also want to find out the levels of apathy and what motivates these political choices.
Why have you chosen it?
I am very interested in Politics & International Relations, and I have enjoyed reading up on political events and actions for most of my young life, just check trough my website, full of many topics from the MENA region to Counter-Terrorism.
It makes me motivated to find out for myself the political science behind political choices and actions, to allow myself to greatly understand the emotional drive of the electorate.
I think that the events happening now are the biggest ever to happen in British politics. History is being made in my lifetime, and will be part of the History books in decades time, I believe this is motivation enough to centre my project on Brexit.
How does it link to your future career?
My project sets me up for greater involvements in political life. It gives me an opportunity to work with young people and to find out what they think on these issues. I want to push forward my opinions and beliefs on these issues and I believe this will help me.
What do you hope to find out?
I want to find out what makes young people tick on political issues, especially Brexit, again this project purely serves as a report on what I want to find out, including, political affiliation, if we should have a second referendum, basic social policy and overall interest in politics. These factors are assembled in my aims and objectives below.
Aims and Objectives
1. To discover the impact that the aftermath of the Brexit vote has on young people below the current voting age (16-18-year olds) in a school’s 6th form, by carrying out personal research and focusing on young people’s thoughts in other opinion polls, while comparing it to overall views.
– Look at current statistics, to show how those over the voting age (18-25-year olds) would vote, with the addition to justify my reports on these perceptions with those of younger age groups and my original 1st objective research.
– Analyse the area of support and tolerance of Brexit from both 16-18 and 18-30-year olds after the referendum.
– Evaluate the opinions of the younger generation on how they feel about their priorities and withdrawal from the EU.
2. To interpret the political affiliations of young people and use this to formulate a reasoning behind their motives.
– Use my own research to collect statistics on political affiliation.
– Contrast the differing views between the young generation and the wider populations.
– Acknowledge the different issues that many in the 16-18 and 18-25 age groups face and compare these with other age groups.
3. To establish the current situation with the Brexit plan.
– Assess the satisfaction within young people in the confidence in the existing governments of successful withdrawal from the EU.
– Review the media representation from a range of sources and ‘experts’ on how successful the withdrawal will be, as well as taking related information from my own research.
NOTE – [x] is the source number. The references of the sources are shown at the bottom of this report in the bibliography. This is done to collect sources to pieces of fact or statistics in an orderly manner.
In my opinion this argument part considered to be useless background, so let’s skip this and move on to the ‘cake’ itself :).
Information – “[x]” is the source number. The references of the sources are shown at the bottom of this report in the bibliography. This is done to collect sources to pieces of fact or statistics in an orderly manner.
LO2/LO3 Rationale – Research Methods

One of my main aims is: “To discover the impact that the aftermath of the Brexit vote has on young people below the current voting age (16-18 year olds) in a school’s 6th form, by carrying out personal research.”
Later on, I will spread my data and include data and research that coincides with revolving political events over Brexit. This will not only give a clear timeline of events to draw upon, but will also show the changing public attitudes and opinions following major political actions such as the enacting of Article 50 .
In all of my objectives, variation in data collection is a key aim for my project.
Aim 1: Objective 1 – My main types of research will involve using my own questionnaires, opinion polls and interview transcripts. It’s important that many types of data are used to support my arguments, so I will make sure to double check any resource I use. Furthermore, in terms of practicality, I find that it will be unrealistic to draw upon an unbiased sample with several hundred respondents because of limited resources.
I will comment on how the sources of this research, for example if a survey is conducted by telephone, post or online. These factors can cause bias in my analysis. For sourced opinion polls, my age range is preferred at 18-24, this is because it’s very difficult to find relative information on younger age groups and a young age bracket used here can be compared to younger groups in my own research.
-
Group No.1 - [16-18] Own Research
-
Group No.2 - [18-24] YouGov Opinion Polls
-
Group No.3 - [25+] YouGov
Aim 1: Objective 2 -I will compare this data with my own personal research in schools. Types of research used include mix of transcripts, questionnaires and interviews. I will send questionnaires to a minimum of 30 pupils from each school, and this will allow me to collect and display this information numerically in graphs, pie charts and tables. Additionally, I’ve complete control over the direction of my research. This age range allows me to research schools and even colleges to get a unique insight into the opinions of teenagers just before the voting age at 18 years old.
The data used in objectives 1 and 2 can be compared to give analytical information and to allow me to closely evaluate my data, and can be used to explain current perceptions of young people and politics in Aim 1: Objective 3 .
Aim 2: Objectives 1,2 and 3 – is to “use my own research to collect statistics on political affiliation”. To support my objective, I will include questions in my questionnaire as to find out what political party is most appealing to my respondents.
Furthermore, the use of interviews, both online and outside to get a more in-depth reasoning as to why people support parties in the way that they do. This will allow me to construct basic arguments and evaluate my collected research in objectives 2 and 3.
My final objectives in Aim 3 involve measuring the popular support for Brexit in younger age groups. This will involve a combined use of both my own research and collected research. I will include my surveys, political policy related questions that allow for diverse analysis and numerical analysis.
My own research collected in the objectives can be used to create a collage of a variety of displayed numerical information formats. Data can be compared, and contrasted, by using graphs and tallies, which will be discussed to a greater detail in analysing and displaying data.
LO3/LO4 – Analysing and Displaying Data

I aim to demonstrate the display of data into multiple graphs, charts, tallies and comparative graphs. In order to maximise the visualization of the data.
To ‘Discover the impact that the aftermath of the Brexit vote has on young people below the current voting age (16-18 year olds) in a school’s
6th form’.
The questionnaire has been sent to several classes in one school and an additional school.
I will analyse their responses and construct varied diagrams on their responses. This will include pie charts, graphs and tables showing the results in the most effective and interesting way. It’s also important that I collate additional quantitative information based on my results, by visually comparing them to the mainstream research from Opinion Polls YouGov.
I hope that by sending this questionnaire, I will get a basic grasp of what young people think about Brexit and basic political policy in general, such as the economy, NHS, Immigration and Education. This will also allow me to explore my aims and objectives in further detail.
The Questionnaire Specimen is located in the Appendix Section of the Report.
Opinion Sample #1
Date: Friday 16th February 2018 – #1 High School
Sample Size – 30 – Age Range: 17-19 (Year 13 and 12 – 6th Form)
Opinion Sample #2
Date: Friday 22nd March 2018 – #2 High School
Sample Size – 58 – Age Range: 17-19 (Year 13 and 12 – 6th Form)
Total Sample Size: 88
The data was essentially collected at comprehensive schools, which makes it unique in nature. I do admit that the scale is small and the results will be localised.
My easy to visualize graphs and charts allow me to easily present data. I have utilised comparisons, percentages and many other numerical methods to have the biggest impact.
Firstly, I will show the data corresponding to my questionnaire, after I will then draw comparatives, combining my own information with that of secondary samples. The graphs are numerically coded for reference.
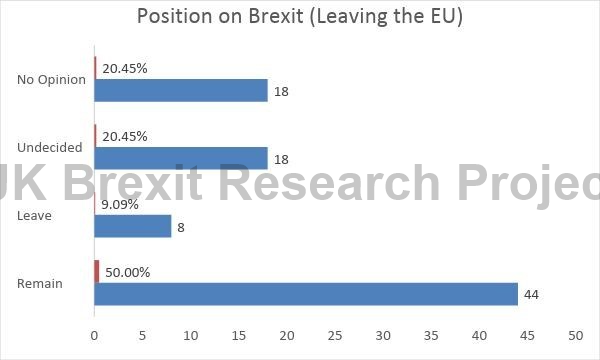
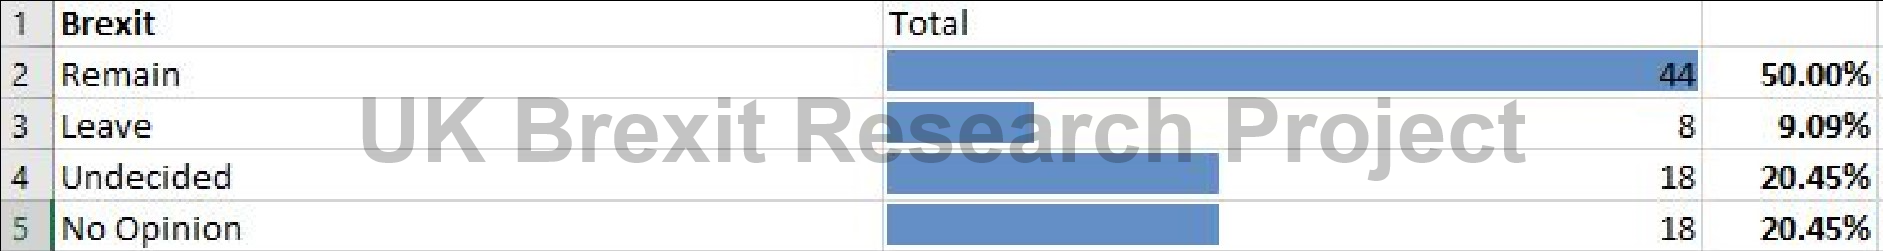
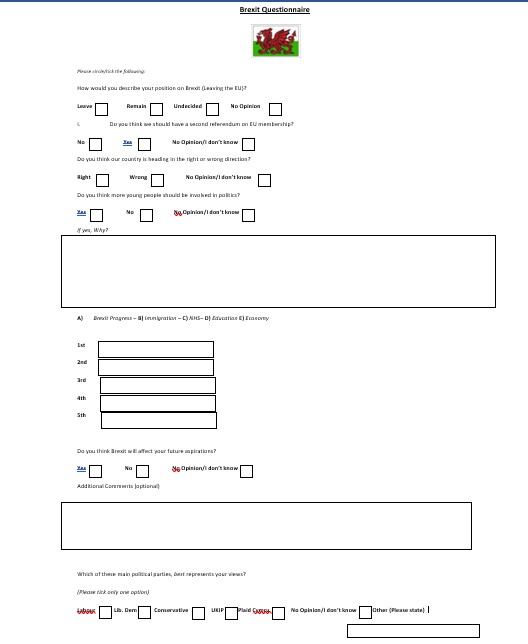
A1: ‘How would you describe your position on Brexit (Leaving the EU)?’
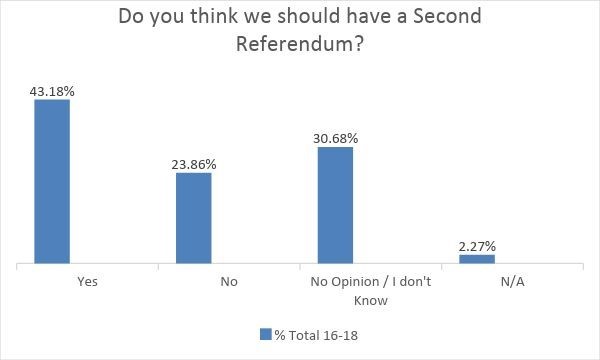
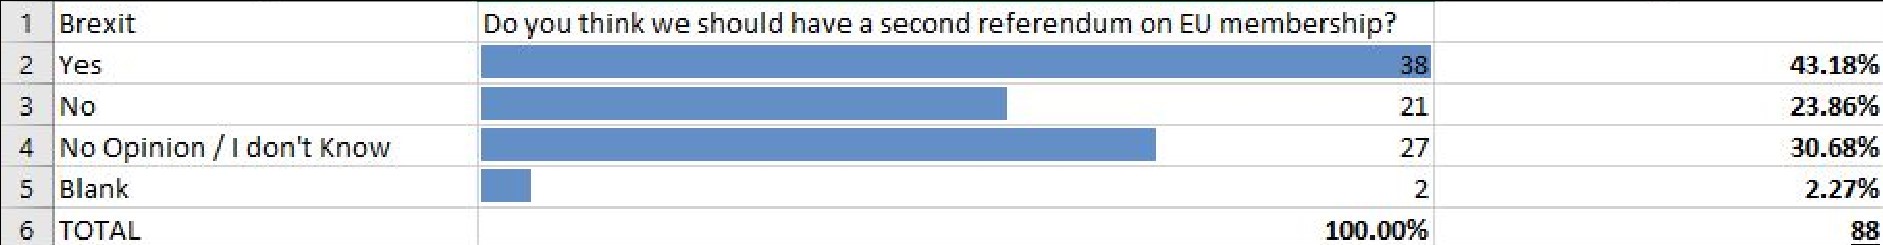
A2: ‘Do you think we should have a second referendum on EU membership?’
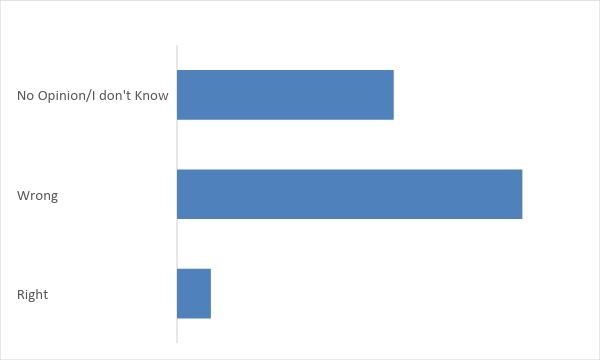
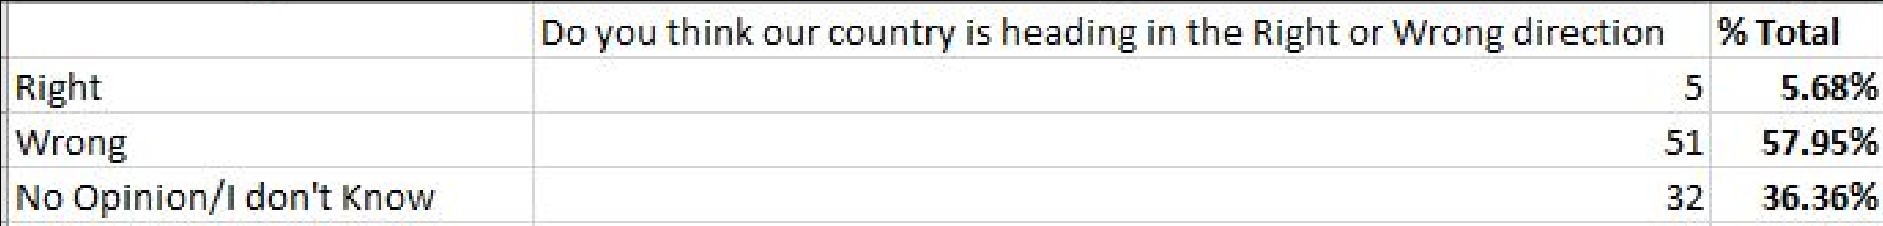
A3: ‘Do you think our country is heading in the right or wrong direction’?
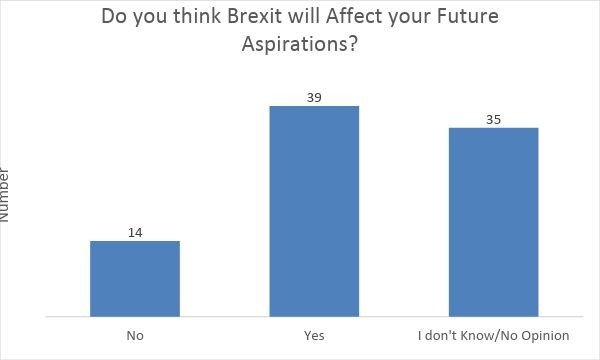
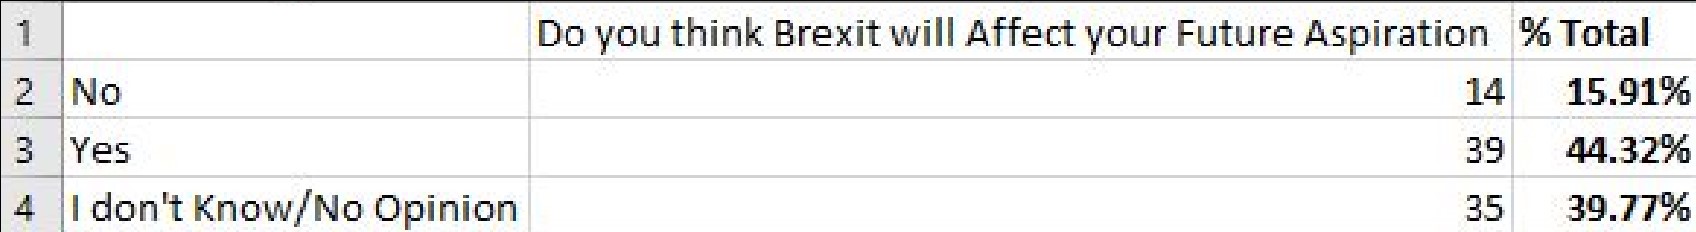
A4: ‘Do you think Brexit will affect your future aspirations?’
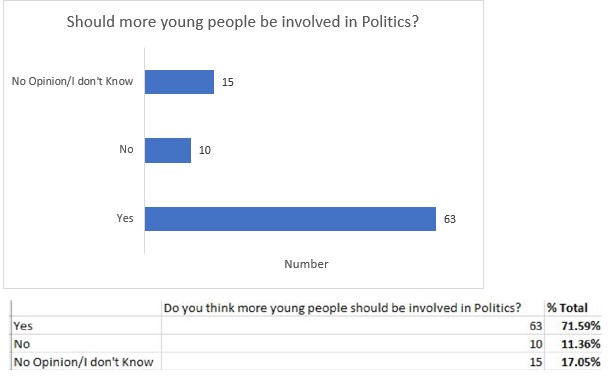
A5: ‘Do you think more young people should be involved in Politics?’
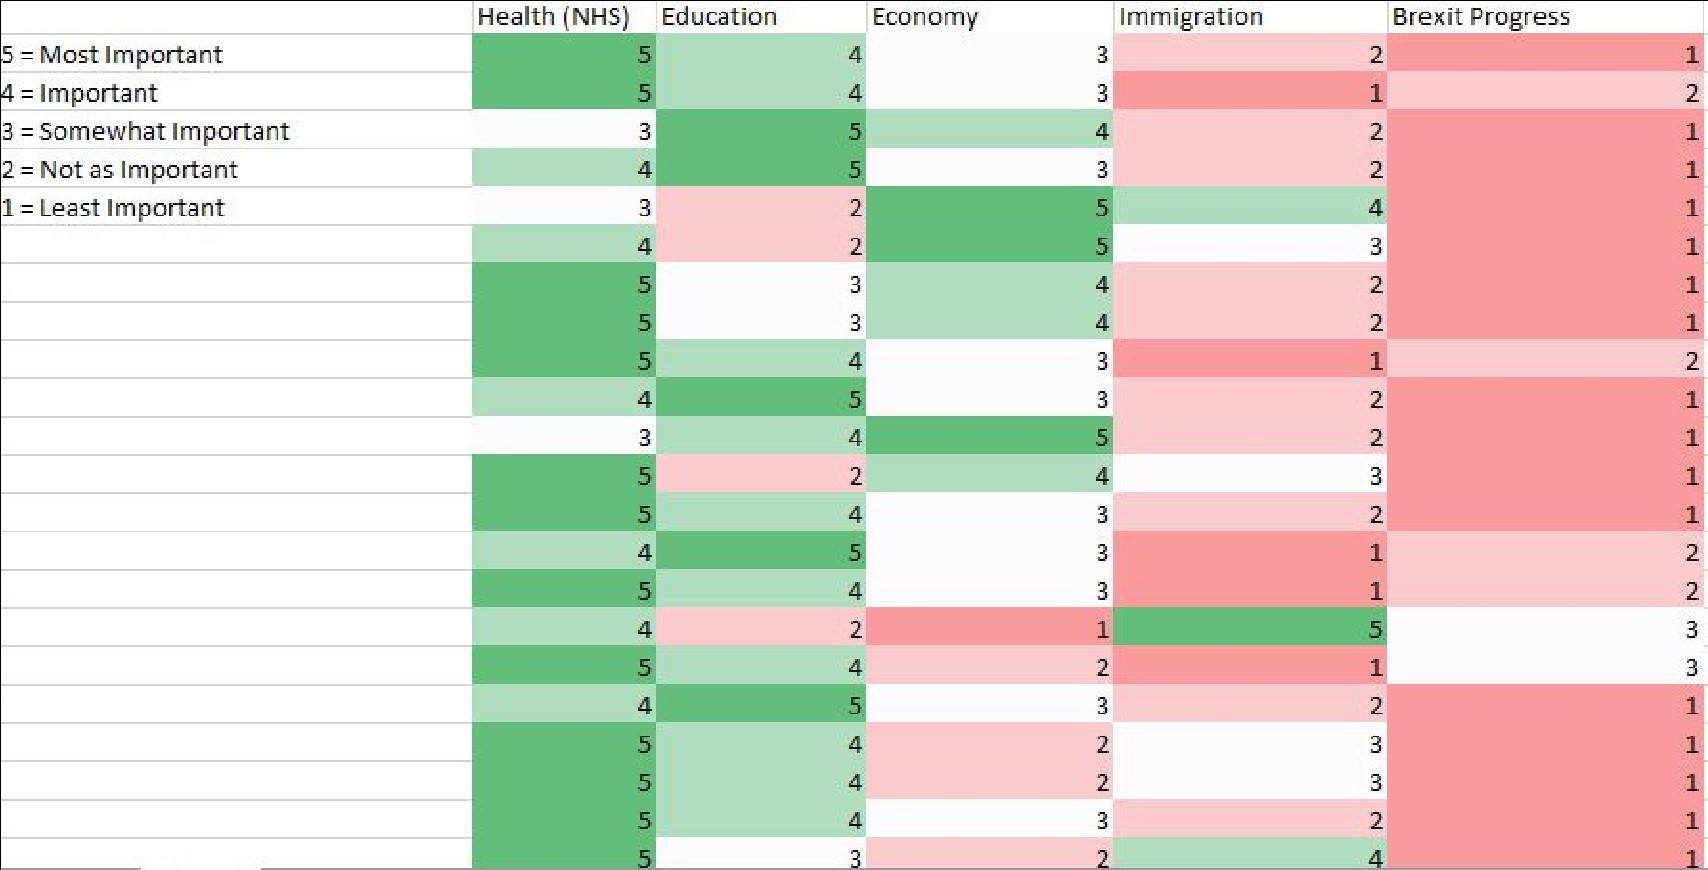
A6: ‘Please put these Issues in order of Importance’.
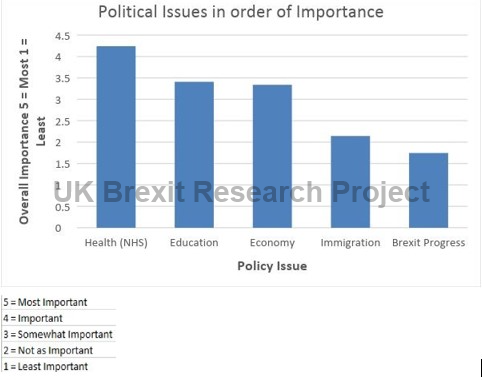
Note: The data below is an ‘average score’ of what respondents put as their most important policies. The higher the score, the more important the issues are.
1st is 5 points, 2nd is 4 points, 3rd is 3 points, 4th is 2 points, 5th is 1 point. The totals were then divided by the total number of points available.
(Points available = Total number of respondents x 5)
The working is shown here:
A6(i) – Which issue is most Important?
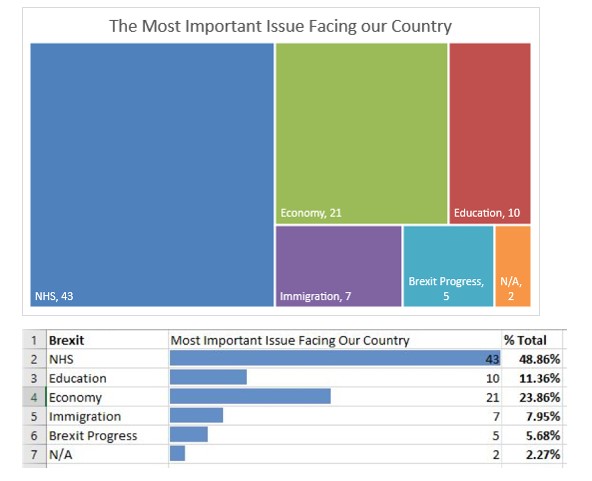
Here is numerical value for the most important issue (1st) from the data collected in A6.
Note: N/A represents that the question had been left blank by the respondent.
A7: Which of these main Political Parties Best Represents your Views?
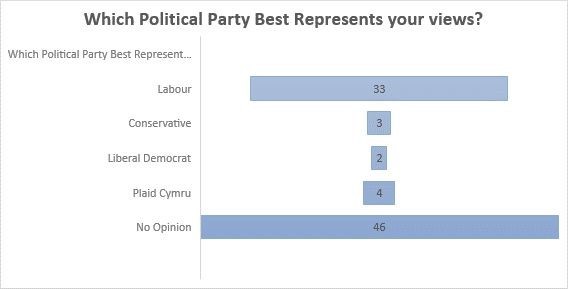
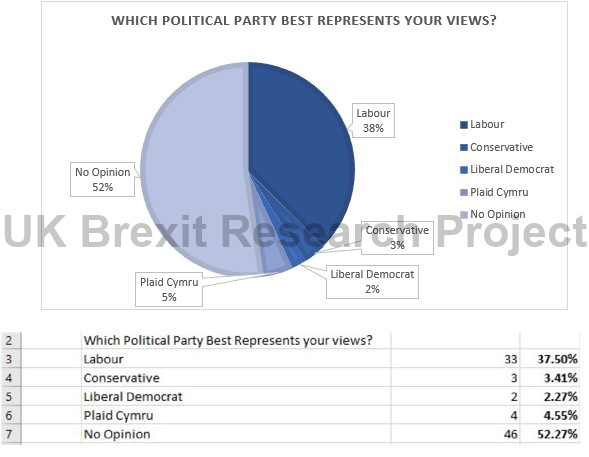
This data is especially important to Aims 2 and 3, as it assesses the current attitude of support to the government from a young generation, with the addition of being a good indicator of political interest.
Comparatives
Figure 1A, 1B & 1C below show my research regarding a Question in my
Questionnaire – ‘Which political Party Best Represents your Views?’.
This was compared with statistics from YouGov ‘If a General Election were held tomorrow, which party would you vote for?’. Sources to all data references are in the appendix.
In order for stronger analysis, I have compared my Secondary Research with my own that was taken at the time of (Jan-March) and one year prior to January and March 2017.
NOTE: If not stated, all YouGov Research is in the age bracket of 18-24. All ‘Own’ Research is 16-18.
Figure 1A:
Measuring Apathy:
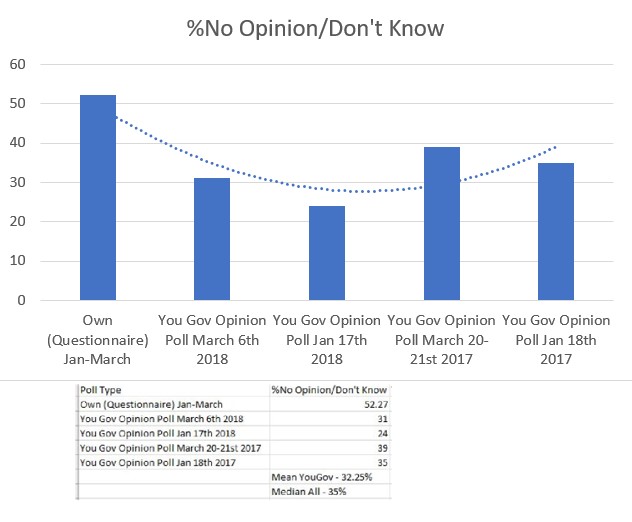
Figure 1B:
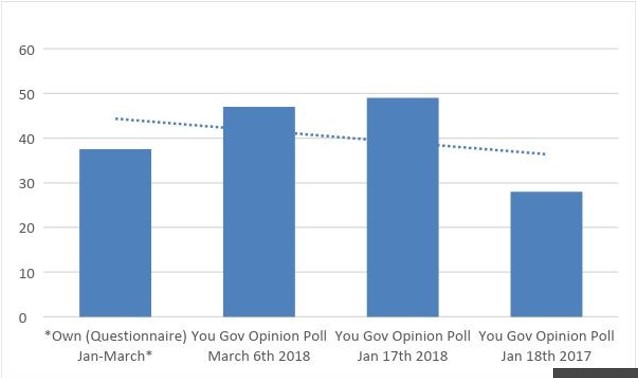
Figure 1C:
This shows the percentage of support for the conservative party.
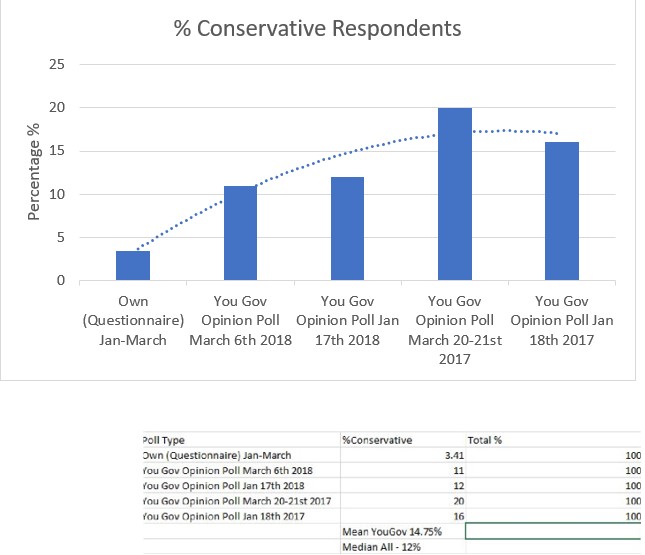
Figure 2A:
The support for a second referendum can be seen here, and this is clearly supported across all research made.
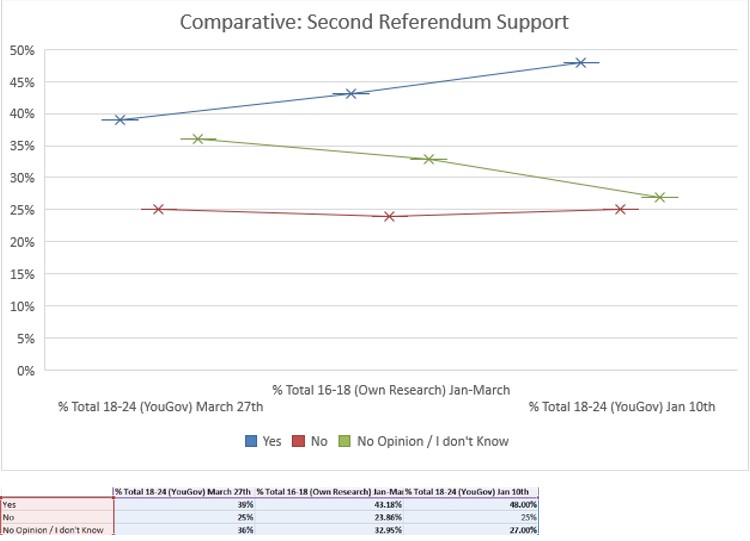
Figure 2B:
‘Should we Leave or Remain in the EU?’
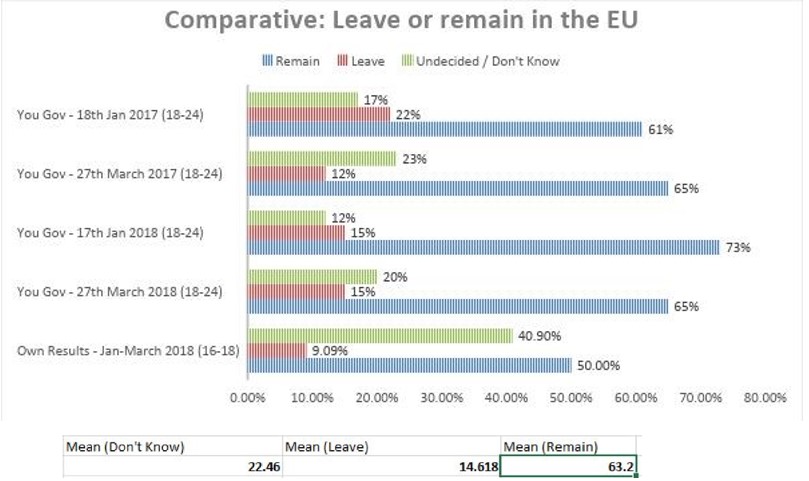
Comparing my results
For Aim 1, my main objectives were to find data for the age groups of 16-18 and 18-24, with the addition of measuring the support and opinions towards Brexit. This includes, among others, finding out second referendum support, regarding support for leaving or remaining in the EU, almost two years since the referendum began in 2016.
For leaving and remaining in the EU, there is a clear point that my Own Results have more than double the mean of respondents respond with ‘I don’t Know’. This is likely the result of higher levels of apathy in my results. It is possible that even though there are levels of apathy in 18-24 quantile, this is significantly lower, as this group has had presumably more exposure to politics than the 16-18-year age group.
Limitations
My results compare with that of a mainstream Polling organisation, YouGov, their research fieldwork involves collecting thousands of samples. Whereas, my own research has a small area and is difficult to compare.
The research collected here will be used to justify my analysis and later evaluations.
The research collected in figures 1a and 2b compares my data with three results of similar data from three respective polling organisations. I will address the similarities and differences in this data and point out reasons why this is the case.
This reinforces the idea that there is a high apathy in younger age groups (16-18) than 18-24, this again, reinforces the suggestion that older groups tend to be more exposed to political events and situations.
My differentiations from graph 1a, 1b and 1c show that both the median and the mode point for YouGov’s data to be significantly different to my own.
For example, the mode for % Conservative support was 3.41 compared with 14.75 for the average score for YouGov’s results. This stark difference exists because of a number of possible factors:
– The sample area has political bias or is an area where the Conservative party does not perform well in elections. (For example, the two constituencies were Labour held in the last election).
– There is a lack of diverse results because due to too few areas sampled.
– There is genuine very high support for Labour in the 16-18-year bracket.
Considering that we do not know the full extent that these influence my results, I think it’s still fair to suggest that the government is not popular overall with younger age groups, therefore the argument that ‘the government is not representative of the young generation’ becomes more valid. There is also a suggestion that, among many other things, that young people are worried about the direction of the Conservative party regarding Brexit and it’s established technocratic nature.
The research here will be a pivotal point to direct my critique and praise. I will shortly add background and explain what the results show, in the analysis. At the same time, I will attempt to compare the results with my secondary research, media narrative and other statistics.
It’s also important to take into account the settings of the research.
My research was collected in schools, in classrooms, while the mainstream researcher conducted their fieldwork online. Because of the fact that the sources were carried out in different environments, it cannot be ruled out that a level of bias exists. My own research carried out was in a more controlled environment and there were no overall demographic preferences. However, it is likely that it was different between the schools. Being closer to the city of Newport, St. Julian’s is likely to have more diverse demographics than Cwmbran.
While YouGov uses responses from an invited internet users group, these are voluntary and in a less controlled environment. Therefore, it is possible that in school, more respondents felt responsible to do a questionnaire, rather than online, where there is no such responsibility. This can possibly explain why there was a significant difference from the mean for ‘No Opinion/I don’t know’ with my own research, and that YouGov’s. This can give the impression that my data can be considered ‘raw’ and unfiltered because of this, as those with very little interest are included.
Despite the large differences, my research does stick to the same pattern. A super large majority, about 50-70% of young people do not think we should leave the European Union and only <10-20% think we should leave.
Further Analysis
There are several important pieces of information that can be derived from this piece of primary research.
Firstly, I will draw upon what the respondents think is the most important issue facing our country. The NHS is by far preferred, by a large majority, over 50% chose the NHS as the most important issue. This agrees with my secondary research and transcripts, which quote these issues directly (on pages 20 and 22 respectively). Although it may be a smaller sample, this research links up that generally ‘there is a greater concern for the NHS and education among the younger generations.’ (Education was ranked as the second most important issue among many in my research).
insert secondary evidence.
Another important pivotal question in my research talks about which political party best represents your views. There is a noticeable answer that most respondents chose: those who have an opinion on politics mostly swing to the Labour party. This could argue that the ‘populist, anti-establishment and youth engagement from Labour is winning support.’ This provides a crucial insight into the future of politics and how politics is changing to suit a young generation mostly cut off from the mainstream political environment.
Another area to point out is the majority of respondents had chosen the ‘No Opinion/I don’t know’ response. Although many more young people engage in politics, than they used to, partly because of Brexit [18] . It cannot be denied that the research still shows that ‘there is a considerable level of political apathy in the young respondents.’ Although, a few comments included in the research called for greater involvement for youth in politics, some mentioned they found it hard to understand politics and were concerned that politics is
‘dominated by the older generation.’
Despite the apathy present in youth, ‘most respondents supported the idea that young people should be involved in politics’, suggesting that there is a will to be more involved.
Regarding issues on Brexit, such as a 2nd referendum and asking respondents on their position on Brexit. Both my primary and secondary research tells us that ‘most young people support remaining in the EU’, and many support a 2nd referendum. Again, the lack of sample size needs to be considered in the response, however there is a clear majority of respondents supporting remaining in the EU in my work (44 – 8 leave). However, 36 out of the 88 total responses were from the ‘undecided/No opinion’ option. It still points out the lack of political opinion in some respondents.
Additionally, on issues such a ‘second referendum on EU membership’, ‘more young people in politics’ seem to have more respondents’ either agreeing or disagreeing, rather than stating ‘I don’t know’. This can suggest that these are less controversial, and perhaps shows that there is a clearer response, rather than a complex response and opinion on Brexit or which political party you support.
From this research, even though its early and not complete, signalises expected results that have been followed through in other secondary research and opinion polls, showing that the argument that ‘less young people support Brexit, than older generations’ is also a valid argument. We cannot determine whether the percentage of young people’s views is determined. In my own research, based on those who had an opinion, 50% of respondents supported remain, while 25% supported leaving and the rest undecided, this pattern with respondents of a similar age, e.g. 18-24 is seen in the Analysis of Secondary Research.
LO5/LO3/LO6
Analysis, Synthesise and Use Information & Present Outcome
Analysis of Secondary Research
I researched the Office for National Statistics would hold referendum results and voting patterns regarding young people and other groups. “The requested information is not held by the Office for National Statistics (ONS). Although ONS produce population statistics for the UK, we do not produce figures on the number of people that vote or that are able to vote.”
The London School of Economics and Political Science is seen as one of the most prestigious [public research] universities in the country. However, as it is based in London, a city with a large majority backing the remain vote, it is possible that most of its students and workers share that majority view. Therefore, I decided to take a more nuanced approach and seek out a think tank ‘YouGov’
Post Referendum Polling – YouGov’s own research
Source: Opinium / Date: 9-12 January ’17 / Sample Size: 2,005 UK adults / Released: 24th January ‘17
The above statistics are a result of sampling from the research consultancy.
Opinion, taken from very early on in the year.
Opinion states [26] that the poll had been “weighed to reflect a nationallyreflective audience”, meaning that the sample has been answered by a proportionally represented sample of eligible voters and has been largely balanced on demographics.
However, there are many issues that need to be taken to assess these results in the correct evaluative manner.
To start, the political background; this poll was conducted several days before the UK PM’s Lancaster House Speech. In her speech, she outlined a “hard Brexit” approach according to some pro-remain commentators. This was one of the most clear indications that the UK intends to leave both the single market and the customs union, thus rejecting other current relationship models, such as Switzerland & Norway. [Source – International Business, 17 th Jan. 2017] & [12] . It is possible that opinions might have changed following this speech, therefore it is something to take into consideration when analysing later polls. From an interview in the same month, Theresa May hinted at “hard Brexit”, dropping hints that we’d leave the EU “in full.”[8]
Contradictory to the view that “most young people reject Brexit”, this appears to show an almost even tie between those who support it and those strongly opposed it.
However, the age range for the youngest group in the sample is 18-34 and it cannot be separated. Therefore, differences on which age groups voted
And most of those less than 25 could be diluted by those over 25 and in their 30s that may have a different opinion. There is therefore unreliability on which age group this represents, whether it be young first-time voters or experienced repeat voters, who would be older.
Source: YouGov / Date: 7-8 November ’17 / Sample Size: 2,012 GB* adults / Released: 8th Nov. ‘17 *Excludes Northern Ireland
This recent opinion poll shows that there is a small majority who think that leaving the EU was the wrong decision
Again, in this recent poll, a gradient between how young people, this time in the range of 18-24, are voting, compared to older age groups. Therefore, there is a clear correlation between age and voting preference, with those who are older are more likely to back leaving than the younger generations.
This is not fully researched yet, however, I am starting to see the general trend played out in these polls. However, this doesn’t discount the fact that there are still many young people backing the leave vote. I can back this up as there is a clear link, even if you detract inaccuracy, between age and preference to either leave or remain in the European Union.
This later poll is more up-to-date than the previous one and it comes after the
UK was trying to unblock EU negotiations, at another speech on the 22nd of September in an aim to “unlock Brexit talks” by offering a 2 year transitional period in between our departure from the EU. [14]
Interviews & Polling Before & After Brexit Vote
A recent “exit poll” [5] from YouGov pointed out that 75% of young people aged 18-24 claimed to vote Remain after polls closed, compared with 25% who voted for leave. This keeps with the idea that a majority of young people who voted, backed the status quo, and not backing the leave vote.
As shown in the article [5], it has pointed that there is a large gap between generations on the Brexit issue. This has also been backed up by my extensive research of post-Brexit opinion polls previously in my report.
There have been many reasons that this is the case. For example, many reports have focused on how our leaving of the EU will “create uncertainty with the education sector”, which is a big concern for the next generation. [13]
A further suggestion is that younger people do not see immigration (a major campaign area for Leave) as such a big issue as older generations do. Younger people are more open minded and more tolerating of globalisation.
A poll [7] taken by YouGov in June 2012, showed that young people aged 18-24 thought Immigration & Asylum was less than half as important compared to as the general GB population.
Despite this being slightly outdated, it is still relevant today, as it shows that young people view immigration as less important compared to the general population. This suggests that younger people are more open minded to new ideas, different concepts.
It is also clear that they value the importance of education and the health service instead. “With more young people struggling with getting on the housing ladder and paying off high tuition debts after university.” [10]
Also, a recent article on immigration that shows that “Ensuring jobs are available scored highest among young voters.” And that “Reducing immigration scored far higher among the over-55 age group.” [11]
This clearly shows a generation divide between important issues. However, this suggests that young people are likely to be more active in society and more supportive of globalization programs such as the single market and free movement of people.
However, in this video [6], where a young UKIP Leave voter also supported a moderate level of immigration, which contradicts with an extreme view that immigration levels need to be excessively controlled.
It is argued that “immigration is needed in well developed countries, like the
UK, in order to fill low paid-jobs that natives do not do.” [9]
It is worth pointing out that media outlets such as the Huffington Post and the Guardian are liberal news outlets, which may have anti-Brexit viewpoints. However, the main statistics will not be affected by this.
I also managed to research data from March 2018.
This research, taken from YouGov [19] shows the views reflected by young people (in this case 18-24 year olds).
There is a majority, and clearly a lot more support for a second referendum for this age group, compared with the overall result (as seen in the research results). There is a clear connection between the supports for a second referendum, and therefore it clearly shows that there is a generation divide regarding the European Union. This links in with my own research of the high percentage of young people supporting a second referendum.
These are the overall results for all age groups from the same survey:
Interviews & Transcripts Taken after the referendum (Own Primary Research)
I have had the unique chance to be able to speak to a wide range of people, on the issue of Brexit, including what they think, how it affects them and the wider country.
These transcripts are anonymous and their purpose is simply to put general opinions into perspective. I will draw upon how it relates to my thoughts and research. They are weighed on gender, age & profession (e.g. teacher/student).
Transcript 1 – Conversation with high school teacher
– “We need to make sure that we get on with the process of leaving, as it damages business confidence, when we continue to be undecided” [on the final deal.]
– “Businesses need to be given time to adjust to new regulations and laws.”
Transcript 2 – Conversation with high school teacher #2
– [I think that] “if we had the referendum again, we would vote to remain”
– “More people are educated about our choice, [and] many people with a good education would support remaining in the EU.”
Transcript 3 –Informal Conversation with student #18
– “People have moved on, they are talking about other things.” “It does not affect us as much anymore.”
Transcript 4 –Formal Conversation with student #2
– “I would rather Brexit was not happening”
– [It will affect] “Everything from buying a house, to buying groceries and the NHS.”
– [It’s] “Not going to help me getting a job’ in the field I wish to pursue”
– [We need to] “Secure the best outcome with other countries” [and] “Work together to get the best outcome.”
Transcript 5 –Conversation with student #3
– ‘It does not matter, so long as it does not affect my situation.’
-‘Even though, I supported remaining in the EU, I don’t think we should have another referendum, it would waste time’ ‘I am worried about our government’s Brexit strategy’.
Analysis of Interviews
By analysing and evaluating my transcripts, I can compare this information with that of mainstream views on Brexit.
My aim 3 includes evaluating the support of the current government, and what young people think about the general Brexit situation with regards to their future. I have already built numerical analysis on A4: ‘Do you think Brexit will affect your future aspirations?’ which shows that a majority do think it will, not far ahead of those who don’t know or have no opinion. This shows the complexity of Brexit, as some question the true extent of the post-Brexit UK.
Transcript 3 is an example of political apathy, while Transcript 4 aims to show a concern from a respondent for their future life and generally think that it will affect their future aspirations.
Transcript 5
These transcripts do not in anyway represent the general young population, however it is important to get emotive personal opinions. I have chosen three of these responses in order to get a balanced view on different perspectives, I believe that it would be unrealistic to collect statistics from interviews, as it would simply involve too few routes for data analysis.
LO3 – Appendix
[20] (The clean copy of the questionnaire can be found in the Appendix)
This part will include all supporting information, source links and transcript notes backing up my project, included within my bibliography.
Brexit Questionnaire
Bibliography
[1] Bloomberg. 2016. EU Referendum: Final Results . [ONLINE] Available at:
https://www.bloomberg.com/graphics/2016-brexit-referendum/. [Accessed 30 January 2018].
[2] BBC By Judith Burns Education reporter. 2017. Young people fear for futures in Brexit Britain, says study. [ONLINE] Available at: http://www.bbc.co.uk/news/education-41165927 . [Accessed 6 February 2018].
[3] The Telegraph – by Ben Riley-Smith. 2016. Leave or Remain in the EU? The arguments for and against Brexit. [ONLINE] Available at: http://www.telegraph.co.uk/politics/2016/06/16/leave-or-remain-in-the-eu-the-arguments-f or-and-against-brexit/. [Accessed 6 February 2018].
[4a] The Guardian. 2010. Neoliberalism is destroying Europe Christian Marazzi . [ONLINE] Available at: https://www.theguardian.com/commentisfree/2010/sep/14/neoliberal-europe-union-austerit y-crisis. [Accessed 6 February 2018].
[4b] https://www.youtube.com/watch?v=CkrRzs4_kkA 1– Video Explaining how young people
voted, and why they did so
[5] Huffington Post UK – Louise Ridley. 2016. EU Referendum Results: Young ‘Screwed By
Older Generations’ As Polls Suggest 75% Backed Remain. [ONLINE] Available at: http://www.huffingtonpost.co.uk/entry/eu-referendum-results-age-data-young_uk_576cd7d 6e4b0232d331dac8f. [Accessed 24 June 2016].
[6] CBC News. (2016). British youth worry Brexit vote will mean big changes . [Online Video].
24 June 2016. Available from: https://www.youtube.com/watch?v=CkrRzs4_kkA . [Accessed: 1 January 2018].
[7] YouGov. 2012. YouGov – British Future Survey Results . [ONLINE] Available at: http://cdn.yougov.com/cumulus_uploads/document/5nfv7cj25l/YG-Archives-BritishFutureYoungPeople-270712.pdf. [Accessed 1 January 2018].
[8] RT (Russia Today). 2017. Theresa May hints at ‘hard Brexit’ outside single market . [ONLINE] Available at: https://www.rt.com/uk/373051-may-hard-brexit-market/ . [Accessed 6 February 2018].
[9] New Scientist. 2016. The truth about migration: Rich countries need immigrants .
[ONLINE] Available at:
https://www.newscientist.com/article/mg23030681-100-the-truth-about-migration-rich-cou ntries-need-immigrants/. [Accessed 6 February 2018].
[10] BBC – By Tom de Castella BBC News Magazine. 2013. Have young people never had it so bad?. [ONLINE] Available at: http://www.bbc.co.uk/news/magazine-21302065 . [Accessed 9 February 2018]
[11] The Guardian – Toby Helm Sun 22 Jan 2017. 2017. Immigration is lowest concern on young voters’ Brexit list. [ONLINE] Available at: https://www.theguardian.com/uk-news/2017/jan/21/immigration-lowest-priority-young-peo ple-brexit-poll. [Accessed 9 February 2018].
[12] GOV UK (government) Jan 2017. 2017. Speech – The government’s negotiating objectives for exiting the EU: PM speech. [ONLINE & with VIDEO] Available at: https://www.gov.uk/government/speeches/the-governments-negotiating-objectives-for-exit ing-the-eu-pm-speech. [Accessed 9 February 2018].
[13] RSM UK – 12/07/16. 2016. Brexit will impact all areas of the education sector .
[ONLINE] Available at:
https://www.rsmuk.com/ideas-and-insights/brexit-will-impact-all-areas-of-the-education-se ctor. [Accessed 9 February 2018].
[14] BBC – 22 nd Sept. 2017. Theresa May urges EU to retain trade terms for two years after Brexit. [ONLINE] Available at: http://www.bbc.co.uk/news/uk-politics-41355642 . [Accessed 9 February 2018].
[15] RT (Russia Today) 4 Dec. 2017. Britain ‘concedes’ over Irish border during Brexit negotiations. [ONLINE] Available at: https://www.rt.com/uk/411863-brexit-border-ireland-trade/. [Accessed 9 February 2018].
[16] www.parliament.uk – June 9. 2017. The Common Travel Area and the special status of Irish nationals in UK law. [ONLINE] Available at: http://researchbriefings.parliament.uk/ResearchBriefing/Summary/CBP-7661. [Accessed 9 February 2018].
[17] City A.M. – Caitlin Morrison – 9 Feb. 2018. Northern Ireland will stay in the Single Market after Brexit – reports. [ONLINE] Available at: http://www.cityam.com/280332/northern-ireland-stay-single-market-after-brexit-reports. [Accessed 9 February 2018].
[18] Spectator – Lara Prendergast 25th June 2016. 2016. Brexit was a harsh political awakening for young people. [ONLINE] Available at:
https://blogs.spectator.co.uk/2016/06/brexit-political-awakening-young-people/. [Accessed 6 March 2018].
[19] YouGov – Opinion Polling. 2018. YouGov / The Times Survey Results . [ONLINE] Available at: https://d25d2506sfb94s.cloudfront.net/cumulus_uploads/document/1daln9otjj/TimesResult s_180305_VI_Trackers_w.pdf. [Accessed 27 March 2018].
[20] 5-6th March YouGov Opinion Poll. 2018. YouGov/The Times Survey Results. [ONLINE] Available at: https://d25d2506sfb94s.cloudfront.net/cumulus_uploads/document/1daln9otjj/TimesResults_180305_VI_Trackers_w.pdf. [Accessed 5 May 2018].
[21] 26-27th March YouGov Opinion Poll. 2018. YouGov. [ONLINE] Available at: https://d25d2506sfb94s.cloudfront.net/cumulus_uploads/document/onal3cjvfu/InternalResults_180327_BrexitQuestions_for_website.pdf. [Accessed 5 May 2018].
[22] 16-17th April YouGov Opinion Poll. 2018. YouGov / The Times Survey Results. [ONLINE] Available at: https://d25d2506sfb94s.cloudfront.net/cumulus_uploads/document/ck1l2ze60y/TimesResults_180417_VI_Trackers.pdf. [Accessed 5 May 2018].
[23] 17-18 January YouGov Opinion Poll. 2017. YouGov / The Times Survey Results. [ONLINE] Available at: https://d25d2506sfb94s.cloudfront.net/cumulus_uploads/document/xalfiwu0ed/TimesResults_170118_VI_Trackers_MaySpeech_W.pdf. [Accessed 5 May 2018].
[24] 26-27th March YouGov Opinion Poll. 2017. YouGov Survey Results. [ONLINE] Available at: https://d25d2506sfb94s.cloudfront.net/cumulus_uploads/document/glo3xaqerh/InternalResults_170327_AnthonyBrexitQs_W.pdf. [Accessed 5 May 2018].
[25] 16-17 January YouGov Opinion Poll. 2018. YouGov. [ONLINE] Available at: https://d25d2506sfb94s.cloudfront.net/cumulus_uploads/document/srb6u4hbl6/TimesResults_180117_VI_Trackers.pdf. [Accessed 5 May 2018].
[26] Opinium 9-12 January 2017 [Brexit Opinion Poll]. 2017. Polling Matters 20th Jan. [ONLINE] Available at: http://opinium.co.uk/wp-content/uploads/2017/01/Polling-Matters-200117-Tables.xlsx. [Accessed 10 May 2018].
Analysis of the Bibliography
Currency – From sources [19] – [25], YouGov opinion polls fit a good purpose for collecting information over a period of time. These sources are from 2017 and 2018, therefore are relevant and up to date when collating and comparing my data over various time scales and gauging my data.
In source number [7], it is from 2014, this is again YouGov data that had been collected from a few years ago, it contains some issues that respondents could list as important but would be less relevant to this day, such as army presence in Afghanistan. It had been undertaken before the rise of major issues such as the declaration of the Referendum on EU membership and the migrant crisis in Europe.
Information included in these polls include political affiliation, Brexit position, policy formulation, from points of view from a variety of age groups, it is appropriate for my undertaking my research. The source data is primarily factual and not opinion based what so ever, which makes it ideal for quantitively analysing information.
YouGov occasionally works with The Sunday Times, a conservative leaning newspaper. However, they claim to be independent from partisan politics, and claim to have predicted many recent elections, especially the 2017 prediction of a hung parliament.
Purpose – YouGov is a think tank that provides data on public opinion. The purpose of YouGov’s research is to essentially sell you its marketing data. As a private for-profit corporation, its main goal is to make a profit. YouGov will choose the date of result collection, wording of questions and demographic weighing.
In general, many of my sources come from news organisations that want to sell you a story, for example The Guardian, Huff Post and The Times essentially want to promote their story to an analytical audience, meaning that their articles tend to be more opinionated than the reality, therefore showing bias. The reporters and writers have a job to do, so they will try and make their articles as interesting as possible. However, the sources [4b.] and [10] are both highly opinionated and produced before the Brexit referendum, limiting their usage in contemporary analysis.
Also, some of my sources come from media funded by foreign governments, such as RT, which have a narrative of information that is aimed towards the UK. This makes that information less reliable.
All of my media sources have a commercial purpose to function as a media business, therefore factual information might become twisted and difficult to find.
Furthermore, additional sources come from governmental institutions and service websites, such as Gov.uk and parliament.uk. It is easier to trust information from the government that is fact checked and official. The information is up to date (no more than one year old) and the website is updated regularly, therefore it is current enough for my topic. Both websites employ sourcing to their information and are highly factual, the objective of this information is purely informing people on the UK government’s activities.
Self-Evaluation
Planning and Organisation
Planning this research has been a large task and I felt that I could have taken a more robust approach when planning my presentation. Nonetheless, undertaking my project has given me a signal of the importance of a plan and to organise work effectively. It’s clear that this achieves maximum efficiency allowing for extra creativity and stress relief.
Critical Thinking and Problem Solving
My project has helped me develop a rule for analysing information. It has formed me into a rigorous thinker and motivated problem solver. Two big examples of this is correcting problems in my data and critically assessing both my sources and my research. Additionally, my project has expanded much needed knowledge for when I get to university.
Digital Literacy
I have had the chance to compose a written report on a computer, and this has enhanced my ability to work, learn and develop further skills on the digital level. Using Excel to develop graphs, work out mean calculations, such as percentages, mean and mode, and then presenting this into a table or other data piece. I have also learned how to collect data and compare it visually in an data sheet.
Literacy
Being literate online has helped me in spelling and has helped me expand my vocabulary and knowledge of terminology.
Numeracy
The research project has allowed me to explore numerical concepts and math. I have been able to think about which numerical method would provide me with the best set of data to compare. This has been especially important, as I want to show the full scope of my results.
Personal Effectiveness
The research and experience that my research project has given me has been highly valuable. I have been able to interact with students and other schools, which has given me the ability to know how collect my own primary research, and form answers and links with this research and other research.
I also believe that conducting my own personal project on a political situation that I am very interested in, will further my knowledge on the subject, as I take it to university level later this year. It gives me understanding of what I think, and therefore at a subject level, this research can be linked with political science as well as politics.
As well as using this research for my own project, it has allowed me to take my own research to further afield, including to schools, individuals and other constituencies.
Doing this research has given me an eye-opening experience into collecting research and analysing people’s views.
Creativity and Innovation
My project has allowed me to explore multiple avenues towards completing my research. I have come up with many ideas including my questionnaire, how to reference and many research techniques. I have given myself enough critique to keep improving on my presentation and to find new ways to present my research.
I have been able to push myself to new ideas and experiences inside and outside of school, ICT and descriptive writing. It has given me experience in dissertation-type projects for university.
LO7 – Conclusion
My Title was to ‘show how Brexit is shaping the minds of young people’. My answer is that it is shaping their minds in a big way and this is pointed out by my interviews and survey results.
From my research, there is a clear divide between political apathy and political participation, a clear super majority of those who do have a political affiliation clearly support Labour more than any other named political party. Nevertheless, there is a significant other who do not involve themselves in politics and others who want to portray a clear message for Brexit.
Brexit is one of the biggest political moments in our modern history and it’s clear that opinions on Brexit are dividing the young and old. There is a majority of young people who reject leaving the EU and a slightly less majority who support having a second referendum on EU membership. Uncontrolled immigration was a strong argument for leaving the EU, yet this is at the bottom of the policy importance for young people. The NHS, followed by Education and Economy are the three most important issues overall.
Such stark opinions from my results are contradicted from older generation groups. It can be almost seen as a juxtaposition of power between the old and young.
Nevertheless, to balance, it is clear that the perception of apathy exists within young people and that sometimes, Brexit can shift the mindset to that of confusion and doubt. The future lives of young people are on the cards at the negotiating tables.
My improvements that I could have made have been documented below.
I feel that I could have included statistics on gender-based voting. This would have allowed me to explore a further avenue as to branch political opinions into respondent’s gender.
As a reflection I also understand that it might have been more advantageous for me to include wider, more comprehensive research on other schools, perhaps in different areas to obtain a larger sample size. This would help in the reliability when comparing my own research to outside research.